Linearity Analysis & Experiments
 |
While experimenting withand describing the early results of the magnetometer, I was fortunate to receive feedback from members of the Society for Amateur Scientists. In one instance, I was pressed to experimentally measure linearity of the magnetometer's response. This page shows this process in detail.
|
Overview
During the course of development and shakedown of the magnetometer Peter Baum, one of the members of the Society for Amateur Scientists, asked how linear the magnetometer is at measuring the terrestrial magnetic field - a reasonable question. To answer that question I undertook a series of experiments which are described on this page. In order to perform an end-to-end system test I built a small test coil which when placed in a specific orientation relative to and distance from the magnetometer and energized with an measured direct current would create an adjustable and accurately quantifiable east-west magnetic field at the magnetometer sensor.
Test Coil
The test coil is a solenoid consisting of 1300 turns with a mean radius of 3.3 cm. The length is about 4 cm and is sufficiently small relative to the distances to the sensor used that it can be neglected in this experiment. In the first "low signal" experiment, the coil was placed 3.65 m east of the TBM yielding a distance to radius ratio of 110. In this configuration it provides a quite pure east-west field with a magnitude of 1.83 x 10⁻⁸ T/Amp of applied current. In the second "high signal" experiment, the coil was placed 1.80 m from the TBM on its west side yielding a distance to radius ratio of 54. In this configuration it provides an east-west field with a magnitude of 1.45 x 10⁻⁷ T/Amp of applied current.
Protocol
To perform the measurement, provide a high degree of internal control, and eliminate some sources of systemic bias an experimental protocol was used which included supplying a certain current to the coil for a specified period of time (30 or 60 seconds in the two reported experiments), removing all current from the coil for the same period, and repeating with a different value of current. The current values used in these experiments ranged from -0.90 to +0.90 Amp in 0.10 Amp steps. The actual pattern of values was generated using a random number generator to guard against a systematic bias. A period of zero current was placed between each value, before the entire pattern, and after the entire pattern.
The presence of "zero current" spaces surrounding each "test current" space provides a convenient means of accurately determining the baseline appropriate to each test current measurement. The average of the measured magnetic field values is subtracted from the measured magnetic field for a particular value of test current. In this analysis, the initial 10 seconds of each period is ignored to eliminate the effect of the transient response of the system. The intent of these measurements is to measure the steady state linearity of the system. Transient response will be studied in subsequent work. The direct current used to energize the test coil was measured to ±0.005 Amp.
"Low Signal" Results
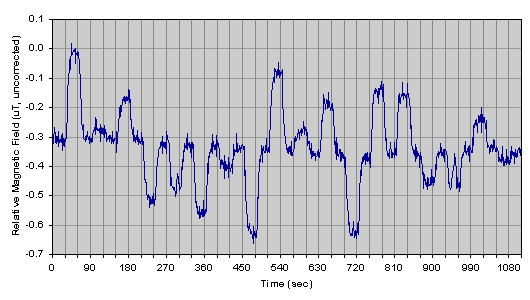
On 11 April 2000 during the hours 0100-0200 UT, the above protocol was carried out and the measured magnetic field record captured for processing. A graph of the raw experimental data is shown here. The time axis begins thirty seconds prior to the application of the first test current. The field axis is uncorrected for the scaling error known to be present and therefore is suitable for relative linearity but not for measurement of the absolute magnetic field. The data points for the last twenty seconds of each thirty second period are averaged to determine the measured field for that period. At approximately 950 seconds the leads to the test coil were momentarily disconnected resulting in the artifact seen in the graph. This test period was treated the same as all others and will be seen to result in an outlying data point.
The first table summarizes the experimental conditions. For each test current the measured average field is presented before, during, and after the test period. The test current and test field are included as is the final baseline corrected measured average field. For the purposes of this calculation the full digital resolution of the measurements is carried through without any truncation or rounding. The benefit of interleaving periods of zero current can be observed in the drift of those values during the course of the experiment which occurred on the magnitude of 10 nT. This drift can also be observed in the graphical data.
The second table presents the results of an analysis of variance (ANOVA) in a regression context carried out on the data using the Excel spreadsheet program (Microsoft Inc.). A single degree of freedom was allowed to vary, namely the coefficient of proportionality between the average measured and the applied magnetic fields. No constant offset is included because it is forced to zero as a result of the baseline correction process. The standard error of 13.4 nT obtained from the regression analysis indicated the level of significance of the average measured field values. The extremely high values of "Significance F" and "P value" for the slope indicate that it is extremely unlikely that the high degree of linearity observed is due to a random event. The high value of "R square" in the regression analysis indicates that 99+% of the variation observed is accounted for by the linear response.
The next graph shows a plot of the applied and average measured magnetic field values. One standard deviation error bars define the average measured magentic field values. The outlying data point corresponding to the 930 second test period can easily be seen. Also seen is another point at 270 second which appears to be significantly outside the group defined by the rest of the points. Careful inspection of the plot of raw data set shows the presence of a previously unseen significant glitch in this period which will significantly reduce the average measured field for this data point.
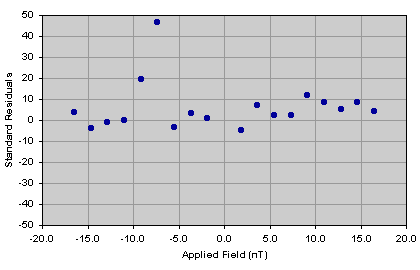
The final graph of this series shows the residuals obtained from a comparison between the original data and the best fitted line. A very slight positive drift of the residuals at positive applied field is easily understood as a rebound-like response to the two outlying data points previously described. Beyond this artifact no significant deviations can be seen in the residuals.
"High Signal" Results
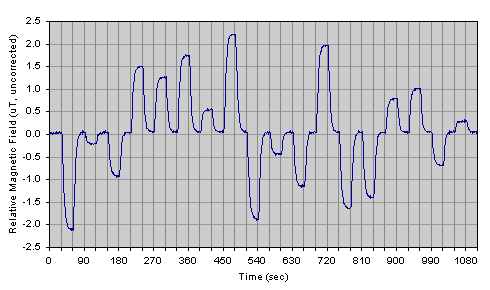
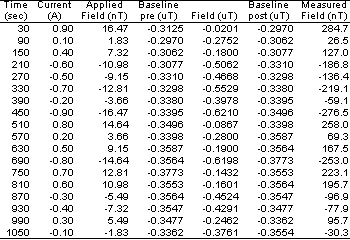
A second experiment was carried out on 14 Apr 2000 during the 0200-0300 (UT) hour. As noted above, the test coil was located at a shorter distance from the TBM and on the opposite side as compared with the first experiment. As the test coil was kept in the same orientation in both experiments, the effective east-west field was expected to be observed as the opposite polarity which was borne out experimentally. The graph to the right shows the raw data obtained from this experiment. The same pattern of current values can be seen easily and the signal to noise ratio is significantly higher. The transient response can also be seen to be substantally longer. In this second experiment, the first twenty seconds of each test period is discarded to account for the slower response. All other data processing and analysis were performed as described for the first experiment.
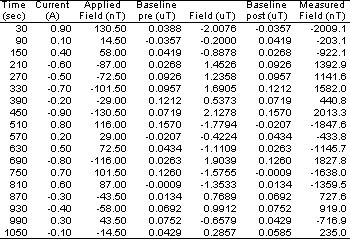
The first table (on the left) shows the summary of the experimental results from the raw data. The baseline correction was applied as described as in the first experiment although in this experiment it is much less significant because the signal is so much larger in magnitude. The electrical connections were made more secure for this experiment and no accidental disconnects or "drop outs" were observed in this data set.
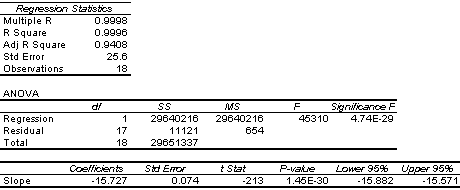
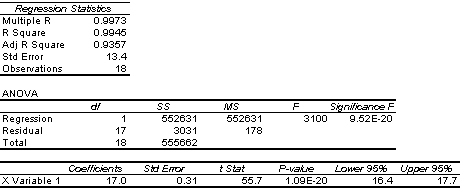
The second table (on the right) shows the results of the ANOVA in the regression context as described previously. In this experiment, the "R square" value exceeds 99.9% and the "Significance F" and "P value" are extremely high as seen earlier again suggesting that the observed linearity is not likely caused by a random event. The higher signal noise and freedom from artifacts result in a significant reduction of the standard error of the fitted linear relationship and the interval defined by the 95% confidence limits is much tighter.
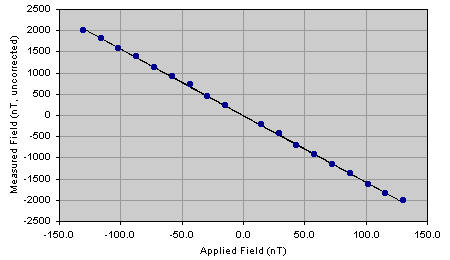
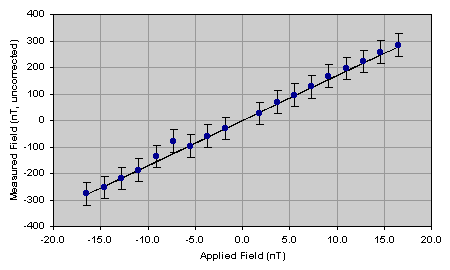
The fitted line is plotted in the graph shown on the left together with the observed experimental points. The one standard deviation error bars are too small to be seen on this graph and have been omitted.
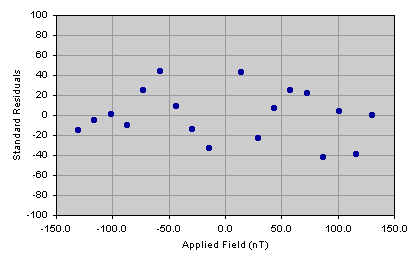
The residuals between the fitted linear response and the original data are plotted in the graph on the right. No systematic variation is observed in these data suggesting that a linear model is adequate to describe the steady state response of the magnetometer quite well and to a high degree of significance.
Home |
Graph Data |
Text Data |
Layout |
Detector |
Laser |
Coil |
Electronics |
Enclosure |
Acquisition
Linearity Analysis |
Harmonic Analysis |
References |
Operator Log

 Copyright © 2001, 2002, 2003 XTR Systems, LLC
All Rights Reserved
Send comments to: Webmaster