This observatory was originally located just a few miles from the radio station WWVB which continuously broadcasts time and frequency signals at 60.0kHz. The WWVB transmitter was used as a early test of the antenna, preamplifier, and transmission line system.
The setup for observing WWVB's strong signal is shown in the figure at the right. The antenna, preamplifier, transmission line are part of the standard observatory configuration. The power supply, workshop transformer, resistive load, and oscilloscope were assembled just for this test. The transformer used in this test is identical to the unit used in the working receiver and the resistor serves as a load for the transformer.
The signal transmitted by WWVB is an Amplitude Shift Keyed (ASK) 60.0kHz carrier. ASK consists of two different amplitudes for the carrier, one corresponding to a logical "1", the other corresponding to a logical "0". Both amplitudes are greater than zero so that there is always some 60.0kHz carrier being transmitted. This eases the design of receivers which utilize this resource but has no impact on the test being performed here. It can be expected to appear in the recorded data as the processed RF signal will depend on the average power transmitted which will, in turn, depend on the relative time the transmitter spends on the higher and lower power levels.
As shown in the second figure a maximum value of 2.0Vpeak-to-peak signal was observed on the oscilloscope which represents the largest radio signal that can be expected to be present in this instrumentation. It is likely that electrical discharges associated with summer thunderstorms will create transient signals larger.
This measurement, while not earth shattering, is helpful for a number of engineering purposes. It does provide an end-to-end on-the-air test of the "front end" consisting of the amplifier, preamplifier, and transmission line which demonstrates that the system is capable of receiving radio signals. It also provides a design validation of the front end's voltage gain. The output is sufficiently distant from the voltage rails that the linearity of the op-amps is assured. At the same time the output is sufficiently large that the stray receiption by the transmission line is likely to be so small as to be negligible.
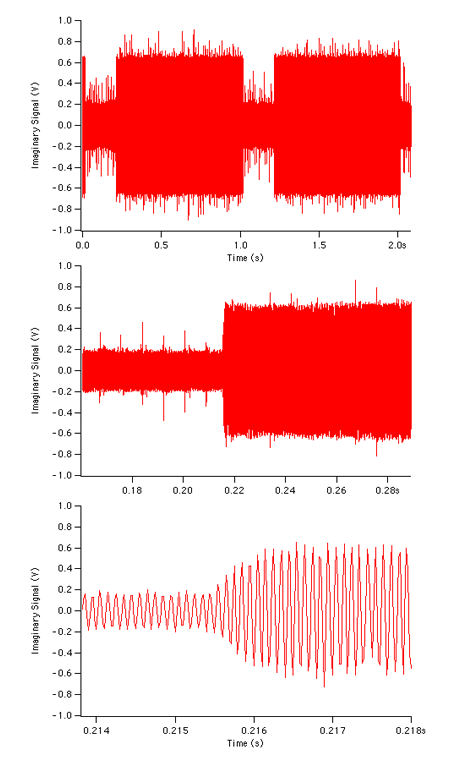
 At the figure on the left the time domain signals captured using a home-made digital oscilloscope can be seen. The ASK signal from WWVB, mentioned above, can be clearly seen as the rectangular waveform whose level is switched between two different amplitudes on a sub-second time scale. Examination of the bottom-most waveform in this figure shows that the transition time from low to high power is recorded as roughly 500us. The transient response of the preamp and digital oscilloscope is at least ten times faster than the measured transition time so it is indicative of the transmitted signal.
Examination of the top-most waveform again reveals considerable "fuzz" present on it. The real nature of this second signal can be readily seen on the middle waveform where it is seen as a regularly occurring series of sharp spikes with a period of 8.3ms. This corresponds to a frequency of 120Hz and reflects the ElectroMagnetic Interference (EMI) environment in the residential location used during this test. The narrow spikes contain significant energy at high multiples (harmonics) of the fundamental frequency of 60Hz which is used in the US power grid. Two spikes are generated for each 60Hz cycle yielding the 120Hz frequency observed.
This test will be repeated a the newer observatory location which is expected to be somewhat "quieter" with regard to this interference and the results will be reported here.
